- BY tictac
- POSTED IN Basic Elements of Photography
- WITH 0 COMMENTS
- PERMALINK
- STANDARD POST TYPE
The digital histogram. One of the great photographic advances brought about by the advent of digital-capture technology is the histogram. Understanding image histograms is probably the single most important concept to become familiar with when working with pictures from a digital camera. You can use the histogram in the field to evaluate the accuracy of your exposures. A histogram can tell you whether or not your image has been properly exposed, whether the lighting is harsh or flat, and what adjustments will work best. It will not only improve your skills on the computer, but as a photographer as well.
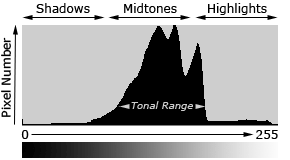
This is a graphic representation of the tonal range of an image. Basically a bar chart, each vertical bar represents the number of pixels having a given brightness value. Each pixel in an image has a color which has been produced by some combination of the primary colors red, green, and blue (RGB). Each of these colors can have a brightness value ranging from 0 to 255 for a digital image with a bit depth of 8-bits. A RGB lue. histogram results when the computer scans through each of these RGB brightness values and counts how many are at each level from 0 through 255. Other types of histograms exist, although all will have the same basic layout as the histogram example shown below.
TONES
The region where most of the brightness values are present is called the “tonal range.” Tonal range can vary drastically from image to image, so developing an intuition for how numbers map to actual brightness values is often critical—both before and after the photo has been taken.
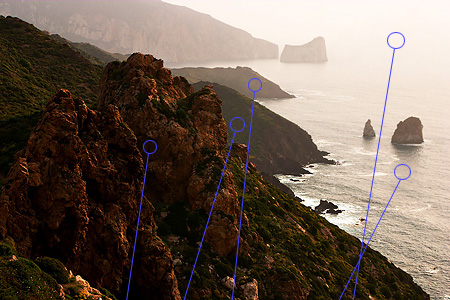
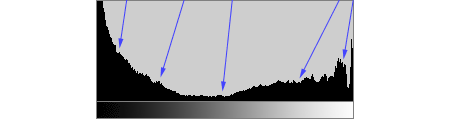
The above image is an example which contains a very broad tonal range, with markers to illustrate where regions in the scene map to brightness levels on the histogram. This coastal scene contains very few midtones, but does have plentiful shadow and highlight regions in the lower left and upper right of the image, respectively. This translates into a histogram which has a high pixel count on both the far left and right-hand sides.
A typical Histogram

The right side of the histogram shows the highlights (bright) data, the left side shows the shadow (dark) data and the center part shows the mid tone data. Normally for a properly exposed image (no over or under exposure) the above is what we get. Of course, it purely depends on what kind of image it is. The curve starts and ends before the two extremes of the highlights or the shadow area.
Histogram representing an underexposed image
If any part of the image is underexposed, this is what happens:

As you can see, on the left side the black part of the graph has gone beyond the vertical line, which means some part of the image is underexposed.
Histogram representing an overexposed image.

If any part of the image is overexposed, this is what happens:The right side of the graph has gone beyond the vertical line which means some part of the image is over exposed.
If your intention is not to over or under expose any part of the image, then typically the complete graph should be between the two extremes.
Contrast
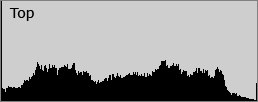
A histogram can also describe the amount of contrast. Contrast is a measure of the difference in brightness between light and dark areas in a scene. Broad histograms reflect a scene with significant contrast, whereas narrow histograms reflect less contrast and may appear flat or dull. This can be caused by any combination of subject matter and lighting conditions. Photos taken in the fog will have low contrast, while those taken under strong daylight will have higher contrast.


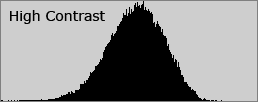
Contrast can have a significant visual impact on an image by emphasizing texture, as shown in the image above. The high contrast water has deeper shadows and more pronounced highlights, creating texture which “pops” out at the viewer.
Contrast can also vary for different regions within the same image due to both subject matter and lighting.

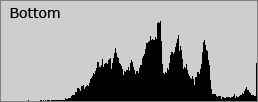
The sum of the histograms in all three regions creates the overall histogram shown before.
Learning to use the histogram in the field will greatly aid your ability to capture perfect images every time.